Line 18: How wealthy is your region?

Monday 5 March 2018 15:15, UK
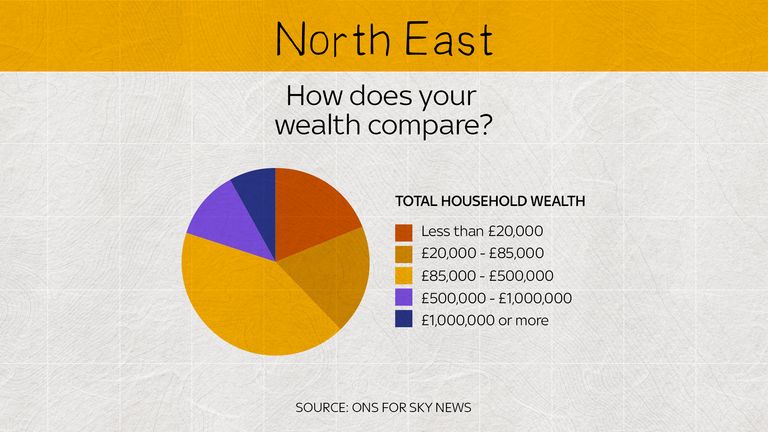
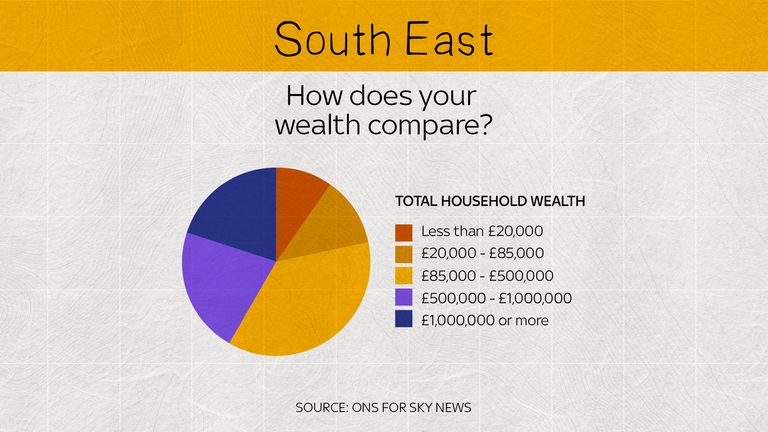
Paste BN financial analysis shows pronounced regional variations, with households in South East England having more than double the wealth of those in the North East of the nation.
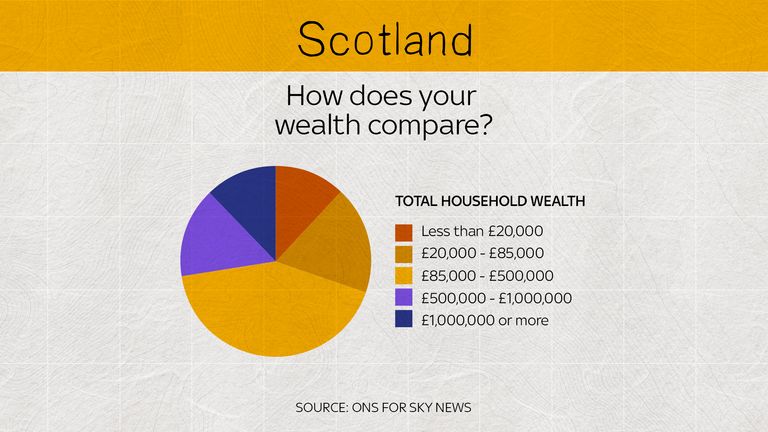
Scottish and Welsh households have, on average, more money than regions in the North of England or in either the West or East Midlands.
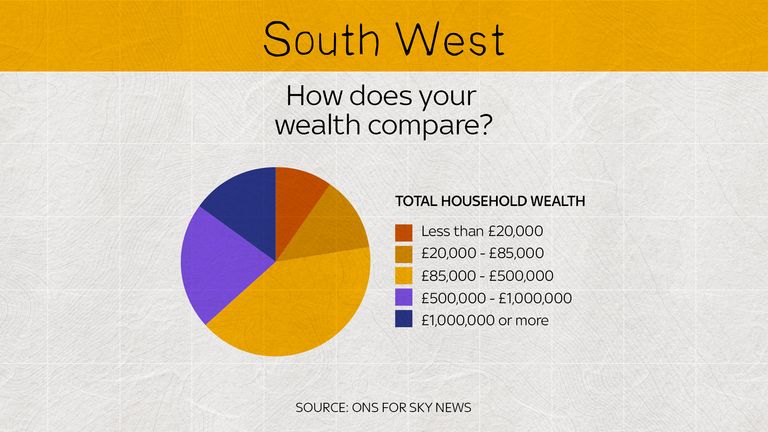
Using the tabs at the top of the page, navigate to find out how wealthy the average household in each British region is, and how the wealth is split.
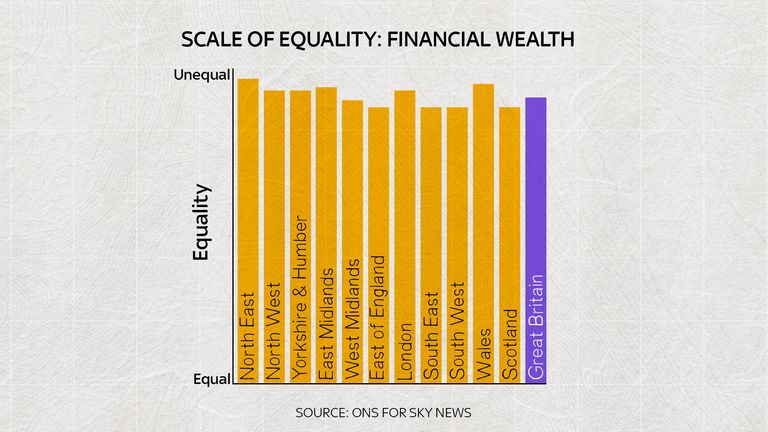
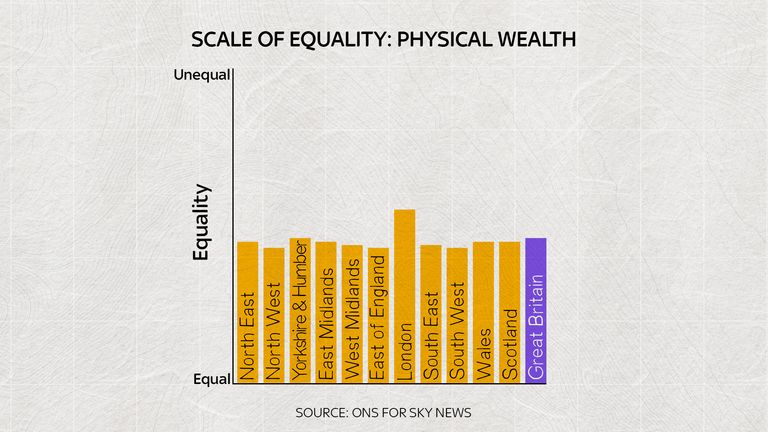
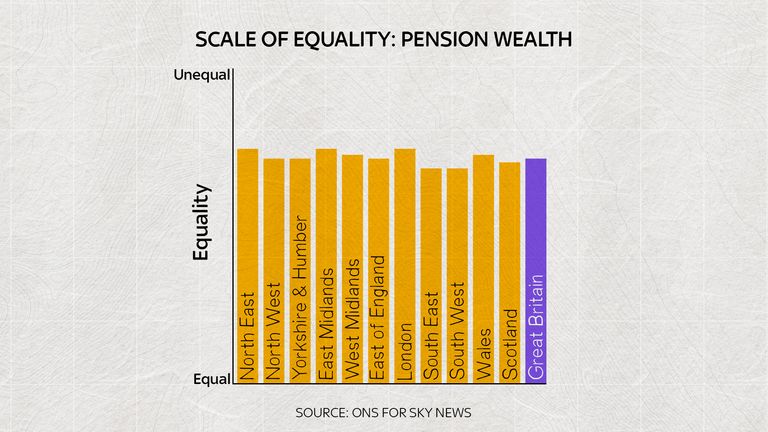
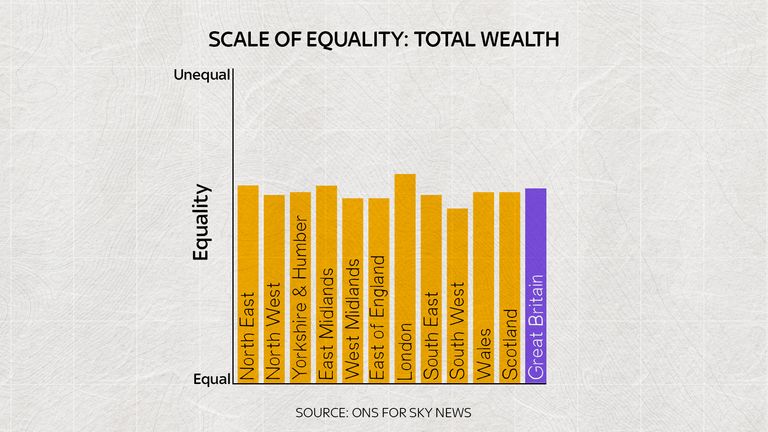
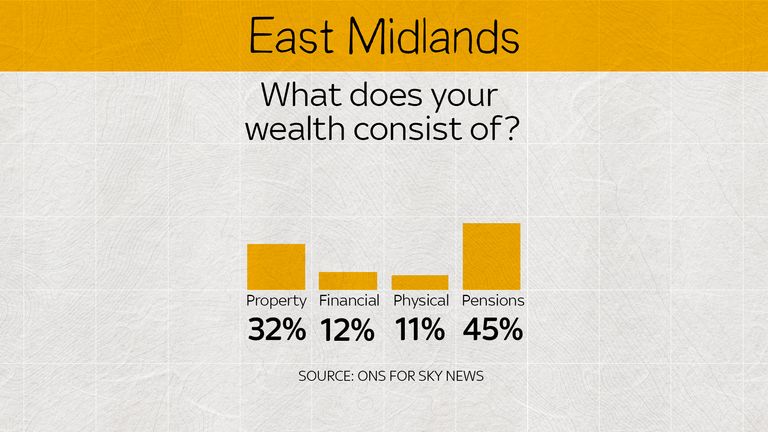
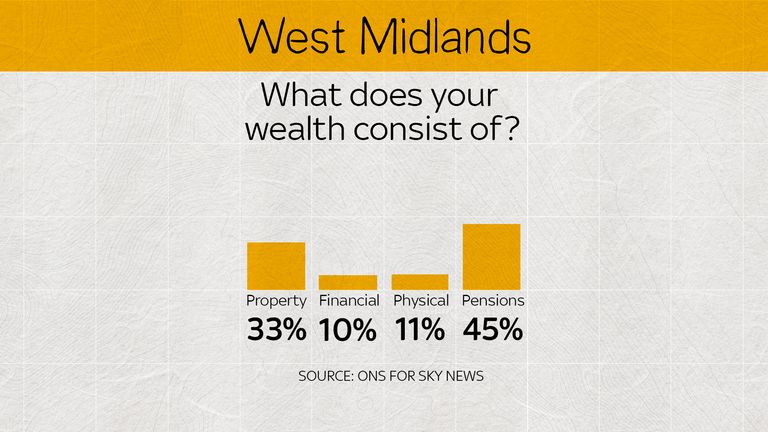
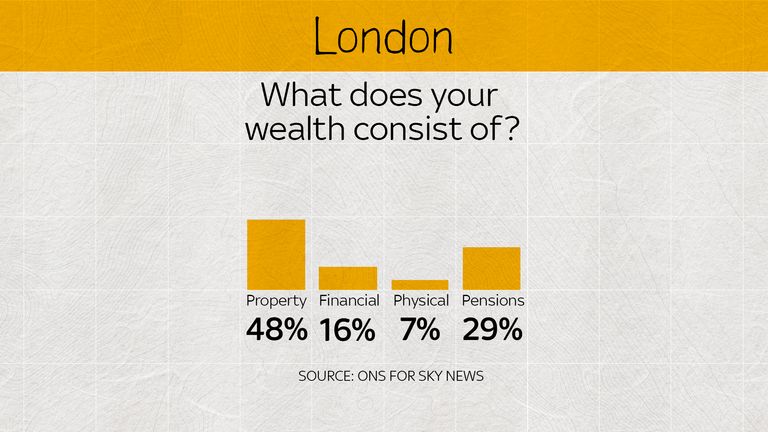
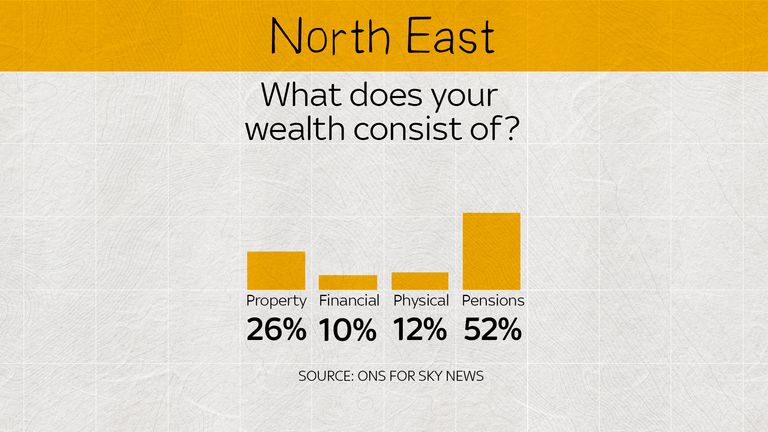
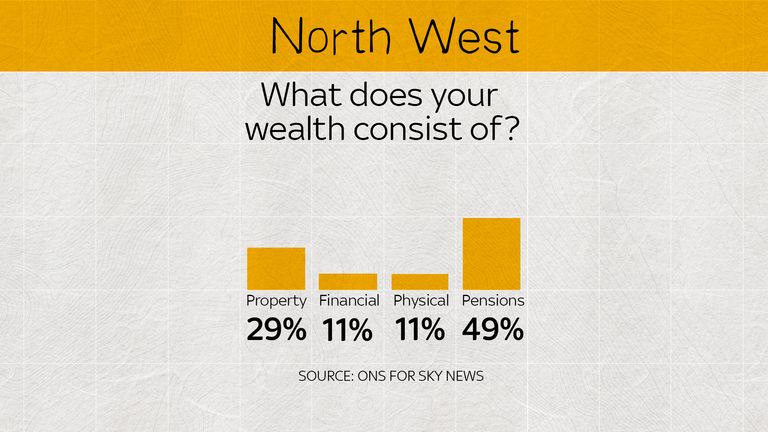
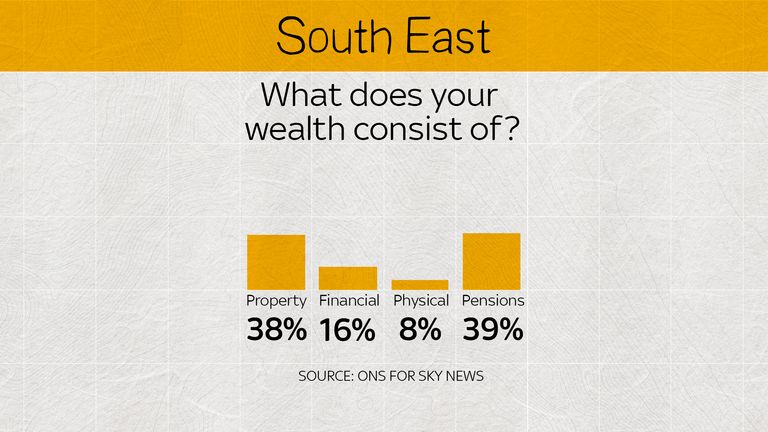
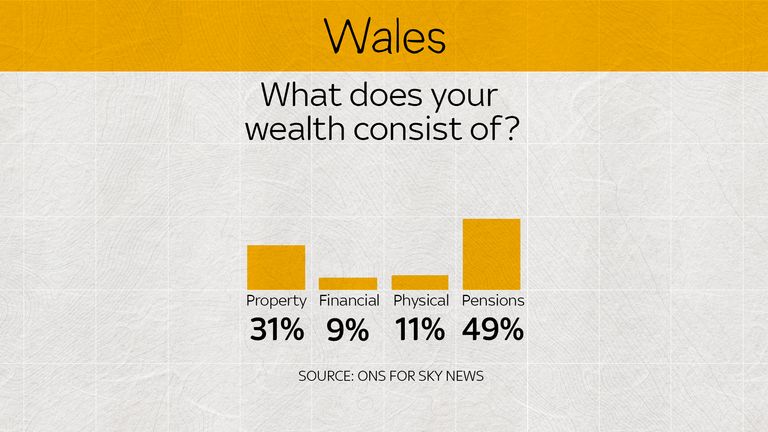
Data from the Office of National Statistics (ONS) shows how equal regions of Britain are based on property wealth, pensions wealth and physical and financial wealth.
The scale was measured using the Gini coefficient, which goes from 0 to 1. The lowest end of the scale, 0, means everyone has exactly the same wealth, to 1, which means one person has everything, total inequality.
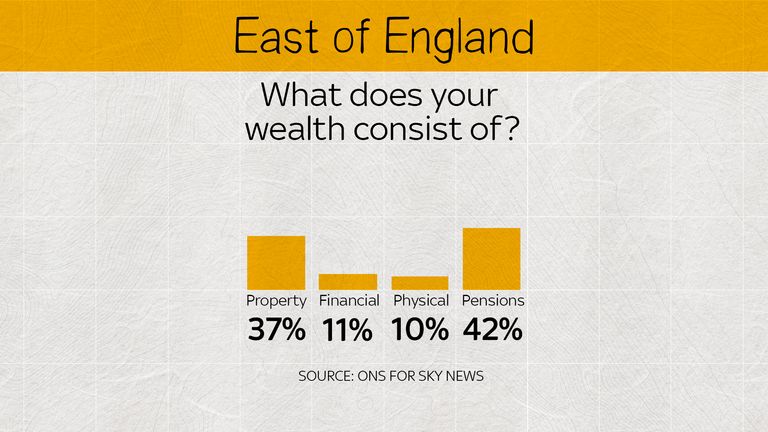
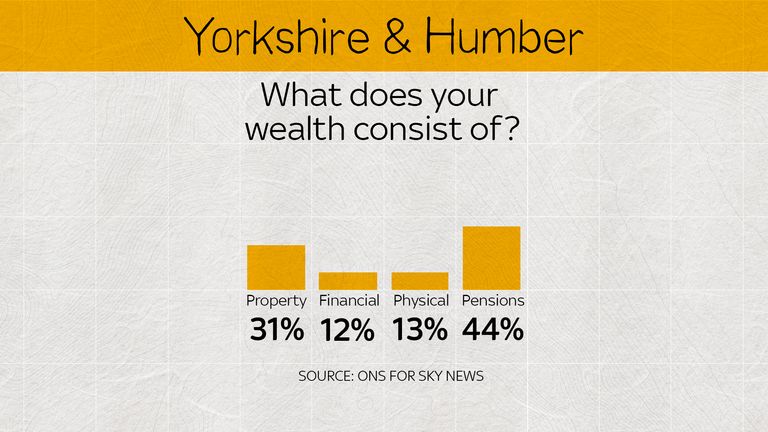
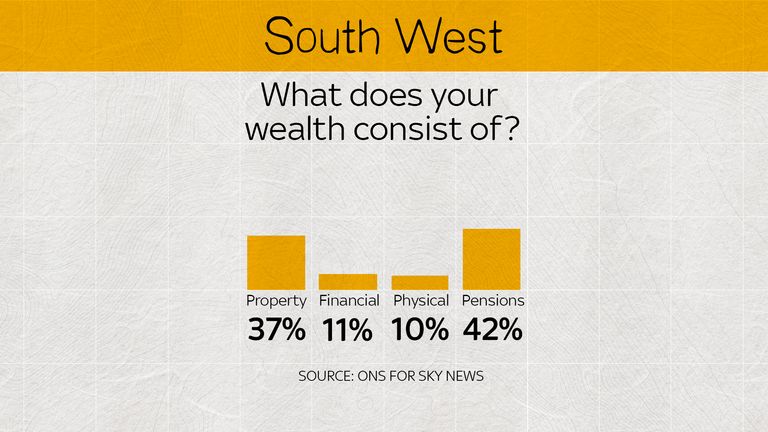
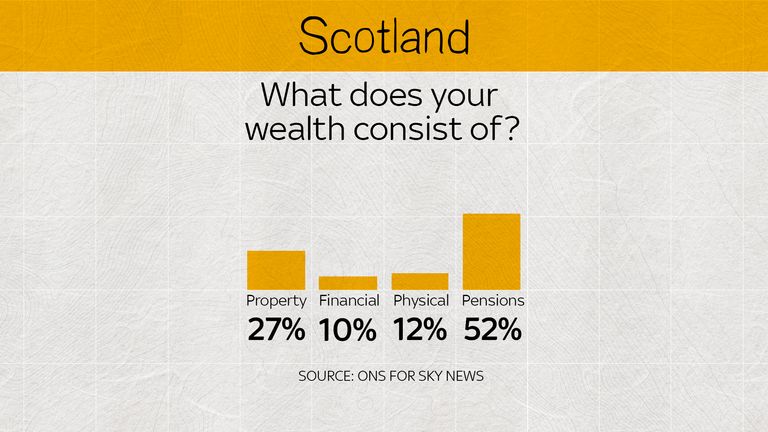
'Financial wealth' is the money in your wallet or bank account.


'Property wealth' is the value of your property.

Physical wealth measures the value of your possessions - like cars or antiques.
Pension wealth measures the value of wealth held in private pensions.
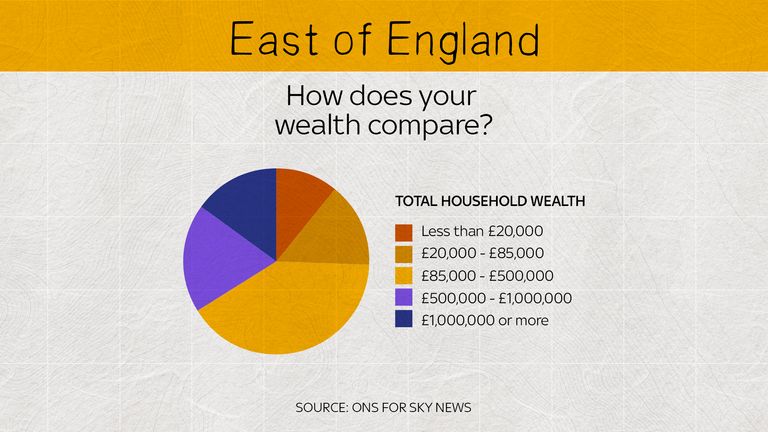
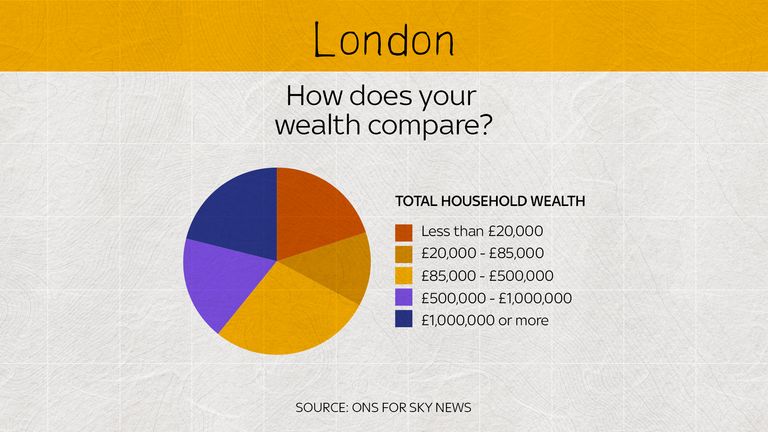
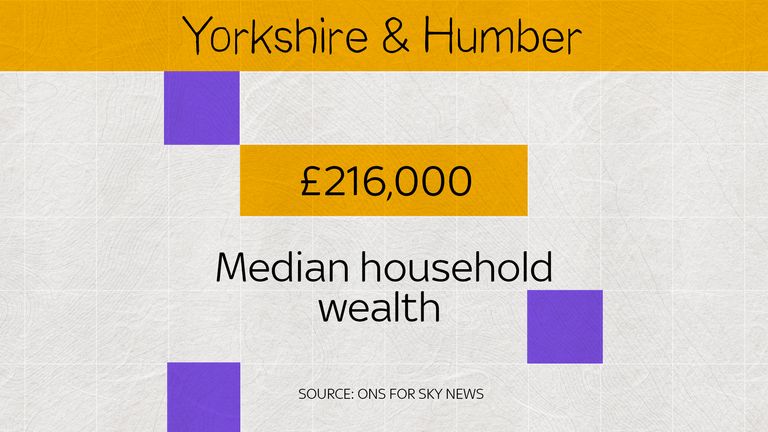
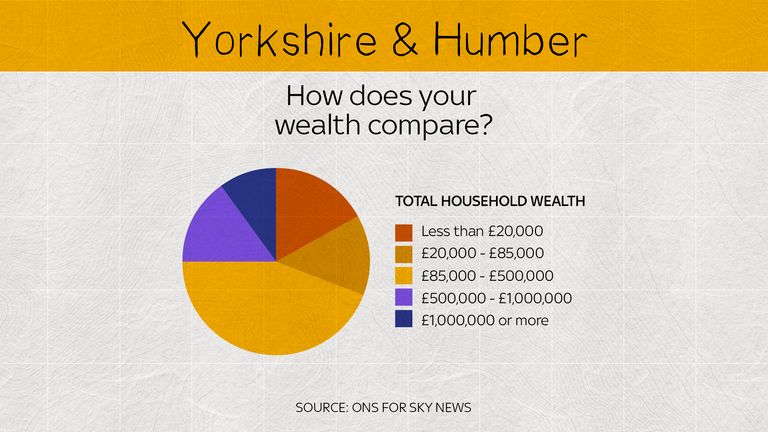
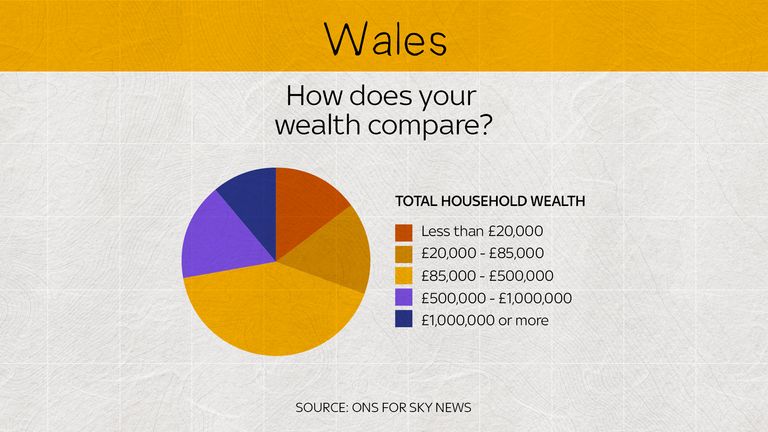
Total wealth refers to the total wealth, including all these factors, held by households.
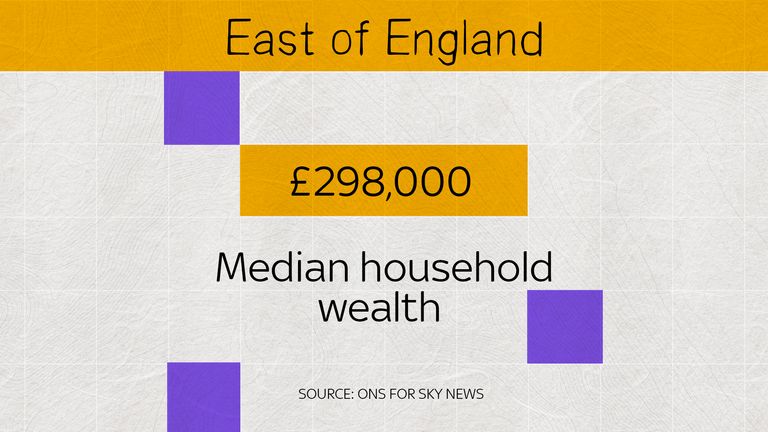
East of England
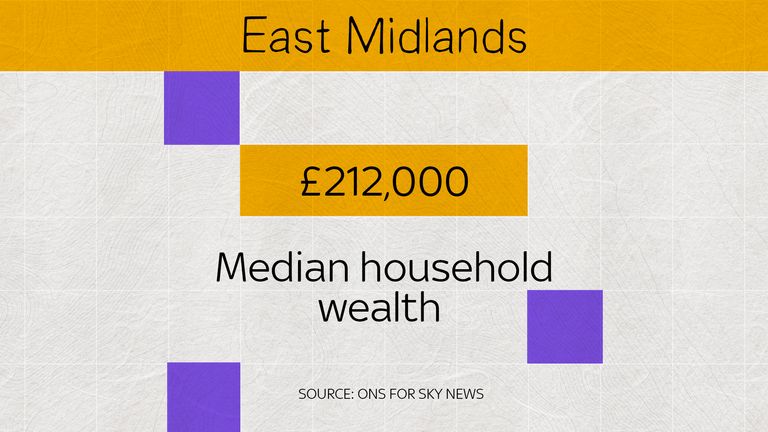
East Midlands

West Midlands


London

Yorkshire and the Humber
North East

North West


South East

South West

Scotland

Wales

The full data set from the ONS is available here.